Labour has won a landslide victory in the UK general election as years of staggering energy bills have left households £2,500 out of pocket due to Britain’s broken energy system.
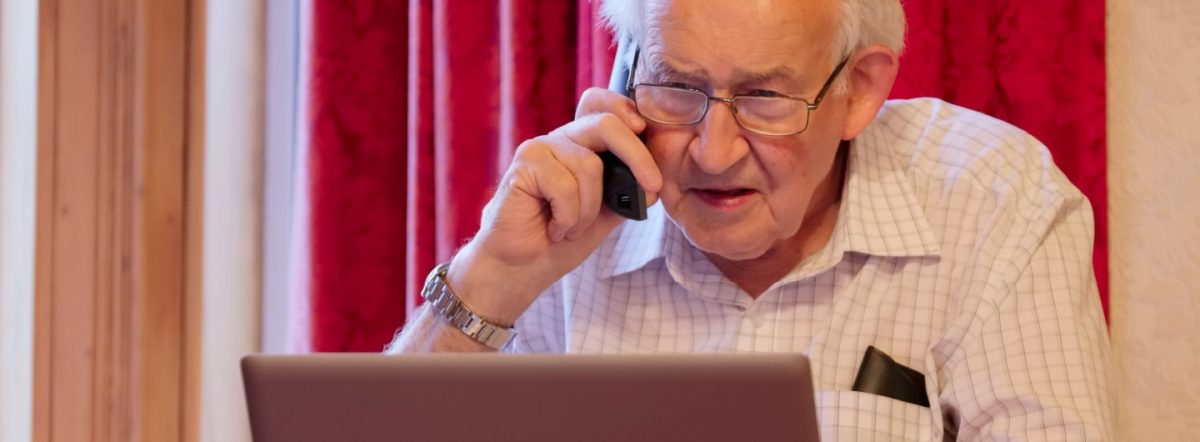
Research published earlier this year found that people are turning to loan sharks to pay their energy bills, millions of people are living in cold damp homes and many are experiencing a mental health crisis driven by high bills.
A spokesperson for the End Fuel Poverty Coalition commented:
“The new Government has said that we will see change and that they will lower energy bills, insulate homes and invest in homegrown clean energy while getting us off oil and gas.
“But Ministers inherit a broken energy system which has prioritised oil and gas company profits while millions of ordinary people have shivered in cold, damp, mouldy homes they can’t afford to heat.
“Lowering bills permanently will take time, but short term steps can be taken to help struggling and disillusioned households.
“The new Government must earn the public’s trust by protecting vulnerable households, reducing energy debt, driving more onshore wind, bringing in changes to energy meters, ramping up insulation programmes, reforming standing charges and ending energy industry profiteering.”
Actions new Ministers will be asked to consider include:
PROTECT VULNERABLE HOUSEHOLDS – Consult on a social tariff, but in the short-term introduce a more comprehensive warm homes discount for vulnerable households so that fewer people have to choose between heating and eating.
REDUCE DEBT – Introduce a Help to Repay scheme to offer a lifeline to millions of people who are trapped in energy debt through no fault of their own, and ban energy companies from selling debts on to debt collectors.
ONSHORE WIND – Lift the de facto ban on onshore wind, which is one of the quickest and cheapest forms of electricity generation to get up and running and supported by nearly 8 in 10 Brits, so that we can start to reduce our dependence on volatile oil and gas.
METERS – Ban the forced installation of prepayment meters for good and require suppliers to fix broken smart meters so that consumers are only ever charged for what they use.
INSULATION – Invest in insulating our leaky housing stock so that vulnerable people do not have to spend yet another winter shivering in cold, damp, and often dangerously mouldy homes.
STANDING CHARGES – Reduce electricity and gas Standing Charges to bring down energy bills for everyone ahead of the next price cap change in October and consult on a social tariff so that vulnerable high-users are not unfairly penalised.
Fiona Waters, spokesperson for the Warm This Winter campaign, said:
“The UK’s dependency on expensive gas is why our energy bills have soared and why so many people have struggled to afford to heat their homes. People have seen through some politicians’ smokescreens and misinformation about net zero.
“With only 103 days of new gas reserves left in the dwindling North Sea it’s no wonder people have rejected candidates who argued for more drilling.
“We need to reduce our reliance on fossil fuels and the energy firms that have made £427bn in profits in the last few years. We need to end energy debt, protect households from the energy market, bring down bills for good, improve housing standards and make Britain a clean energy superpower.”
Greenpeace UK’s co-executive director, Areeba Hamid, said:
“This landslide victory has buried Sunak’s divisive anti-green agenda once and for all and is a powerful call for change. Voters have resoundingly rejected his climate rollbacks and elected a party with a proper plan to turbocharge cheap, clean, renewable energy – promising to slash emissions, lower bills and deliver hundreds of thousands of new green jobs.
“However, the Green surge and success of the Lib Dems, who stood on much bolder climate and nature pledges, shows that there is a genuine appetite from voters for much stronger green policies from the government. Keir Starmer must take note.
“Our new Prime Minister must show real leadership on climate and nature – both at home and abroad – demonstrating that the green transition can be done in a fair and equitable way. He must seize the opportunities for economic revival and energy independence that delivering a greener, cleaner Britain presents.
“But to do that he must take on the elites, increase taxes on the super-rich and polluting companies, and invest, invest, invest. Invest in cheap, clean power and create new, secure green jobs for workers. Invest in warm homes, trains and buses to lower our energy bills and transport costs for good. Invest in greener farming and restoring nature so our rivers become free from sewage once more and wildlife can flourish. This is the change people voted for – it’s time for Starmer to deliver.”
Tessa Khan, executive director of Uplift
“The public has voted for a government that is promising to fix our broken energy system and tackle the climate crisis.
“Scottish Labour’s platform of green growth and the transition to clean energy, in particular, delivered huge gains. People in Scotland know that the North Sea is in decline – with jobs supported by oil and gas more than halving in the last decade, despite hundreds of licenses being issued in this period – and that clean energy is the only way to deliver a fairer and more secure energy system in the long term.
“The lesson for all politicians is that policies that tackle the climate crisis and lower bills are popular with the British public, with the Greens making gains and the Conservatives’s backtracking on environmental commitments losing them support in large parts of the country.
“This new government must now get on with the crucial job of rolling out renewables and insulating homes to lower bills, and ensuring that the UK has a coherent transition plan that ensures workers and communities benefit from the shift to green energy.”
A spokesperson for Climate Cymru added:
“The UK parties with the most robust climate manifestos have quadrupled their number of MPs. The parties with strong climate manifestos have doubled them. There is a strong public mandate for action and it is time to get on with it.”
Angela Terry CEO One Home commented:
“British citizens want to go green but don’t know how so public education is critical. The new Government must prioritise tackling climate change and in particular insulating people’s homes to keep the heat in and reduce bills and carbon emissions for the long term.”