This page is now out of date and will not be updated. Development of the Fuel Poverty Risk Index has been taken over by the Open Data Institute. Details on the 2022 report can be found here:
Fuel poverty risk index reveals areas under greatest energy bills threat
Fuel poverty is set to increase substantially this winter.
With the latest Ofgem price cap increase coming into effect, the Universal Credit uplift coming to an end and inflation increasing to 3.5% – more and more households are going to struggle to stay warm and well.
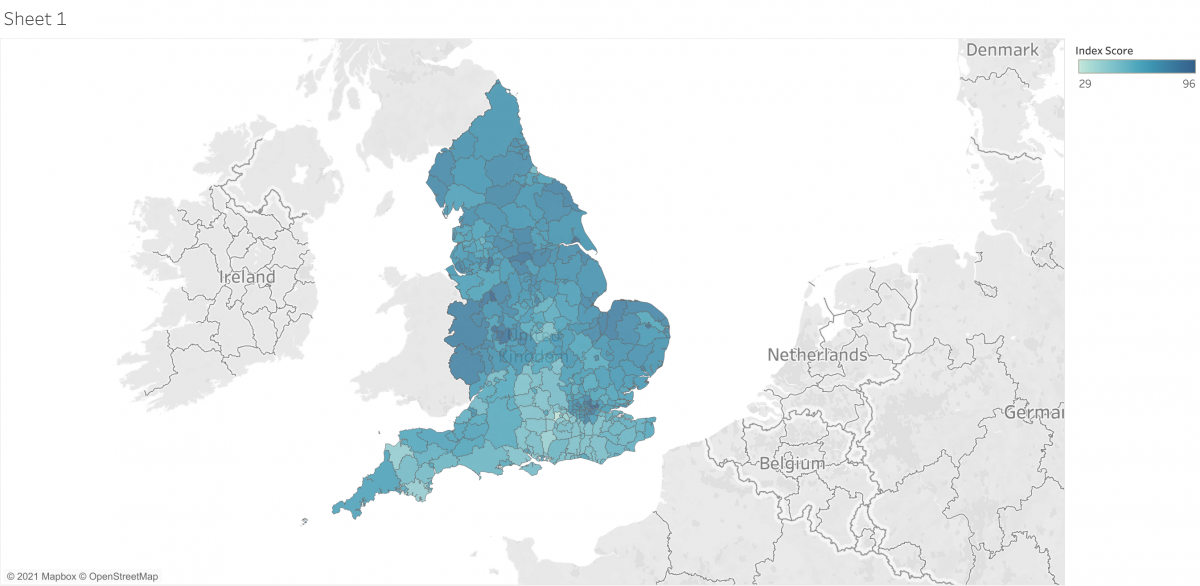
The English Fuel Poverty Index maps the latest data on fuel poverty to local authority level for the first time. A technical version with more detailed data labels is also available online.
Local authorities can find out how they can tackle fuel poverty by reading and passing our Motion for Councils.
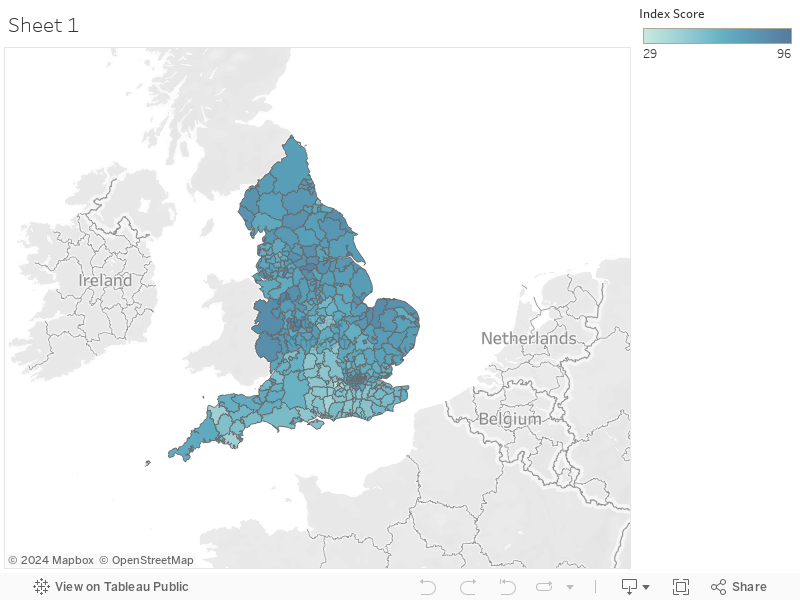
The Index compares each local authority district’s fuel poverty rate to the level of support provided through Eco Flex measures and Low-Income Green Homes Grant Vouchers (LIGHGV). This provides an Index score ranging from 0 to 100, with 0 being the best score and 100 being the worst.
Barking and Dagenham receives the worst score in the country, with a score of 96. This is because it has one of the highest fuel poverty rates and sees very few Eco Flex and LIGHGV measures distributed relative to its fuel poor population.
Bracknell Forest performed the best, with a score of 29. The Index exposes a significant divide between the North and South as well as stark inequalities between the boroughs of London.
The average score on the Index is 67.
The End Fuel Poverty Coalition thanks David Southgate at Age UK for compiling the Index and the data visualisation.
Detailed methodology:
The Fuel Poverty Index is made up of individual scores for each local authority district in England. A calculation is used to work out each district’s score. The scores range from 0, representing the best score, to 100, representing the worst.
The score is made up of three metrics; the local authority district’s fuel poverty rate, its distribution of Eco Flex measures (which allows local authorities to help those in fuel poverty improve their energy efficiency) and the distribution of Low Income Green Home Grant Vouchers in the area (LIGHGV, which covered the entire cost of energy efficiency improvements under the scheme that closed on 31 March for new applicants, but is still being delivered).
A score of 0 represents a perfect score, meaning that a local authority district has the best fuel poverty rate in the country and distributes the most ECO Flex and Low Income Green Home Grant Vouchers (LIGHGV) measures relative to the number of people who are fuel poor in the area.
A score of 100 represents the worst score possible on the Index. A score of 100 would mean that a district had the worst fuel poverty rate in the country and distributes the least ECO Flex and LIGHGV measures relative to the number of people who are fuel poor in the area.
In practice, no local authority district received the worst or the best score. This is because a score of 100 could only be achieved if a local authority district had the worst fuel poverty rate and the worst distribution of Eco Flex and LIGHGV at the same time. As an example in the October 2021 edition of the Index, Barking and Dagenham received the worst score overall, of 96.
This is because it has a very high fuel poverty rate and distributes very few Eco Flex and LIGHGV measures relative to its fuel poor population.
Note that the Index does not yet include support for homes under the LAD programme (where local authorities in England can submit bids for funding to improve the energy efficiency of the homes of low-income households in their areas).
Source data:
March 2021 GHG Stats release (https://www.gov.uk/
Methodological caveats:
-
- Local authority district fuel poverty data is based on small sample sizes. As a result, the precise fuel poverty rate should be seen as an estimate rather than the precise figure.
- Data from Eco-Flex and LIGHGV is the latest 2021 data. Government fuel poverty data suffers from a 2-year time lag. As a result, the Index is representative of fuel poverty rates in 2019 rather than today. This is nonetheless the most up to date data available.
- In cases where no ECO Flex or LIGHGV data was available the local authority district received the average score for that measure.